
Run spectrum#

Velocity metrics package illustration: Run spectrum#
Agulhas, BFN-QG#
Authors: Datlas Copyright: 2024 Datlas License: MIT
Agulhas: BFNQG currents maps
Agulhas: BFNQG currents maps
The notebook aims to illustrate how to run the velocity metrics. Here, the example uses surface current maps produced by the BFN-QG in the Agulhas region.
The notebook aims to illustrate how to run the velocity metrics. Here, the example uses surface current maps produced by the BFN-QG in the Agulhas region.
[1]:
import velocity_metrics.spectrum.spectrum as spectrum
import sys
sys.path.append('../')
from src import utils
Parameters#
Input directory#
[2]:
input_dict = '../dc_data/DC_example_BFNQG_Agulhas/dictionnaries/'
Output directory#
[3]:
outputdir = '../results/metrics_illustration/'
Evaluated maps parameters#
[4]:
path_dict_product =   input_dict+'data_type_metric_illustration_bfnqg.json'

utils.print_json(path_dict_product)
data_type : BFNQG1
label : Metric illustration BFN QG
path : ../dc_data/DC_example_BFNQG_Agulhas/maps_BFNQG
pattern : BFNQG_WOC_Ugeo_daily
match : BFNQG_WOC_Ugeo_daily_(\d{4})-(\d{2})-(\d{2}).nc
varu : ug
varv : vg
nlon : longitude
nlat : latitude
Region parameters#
[5]:
path_dict_region = input_dict+'region_metric_illustration_Agulhas.json'

utils.print_json(path_dict_region)
name : T1_AGULHAS
lllon : 11
urlon : 33
lllat : -44
urlat : -27
coords : [[12, -28], [32, -28], [32, -43], [12, -43], [12, -28]]
1. Compute spectrum#
[6]:
dic_spectrum = spectrum.run([path_dict_product], path_dict_region, depth = 0, output_dir= outputdir)
Percent: [#############################-] 96.77%, ,
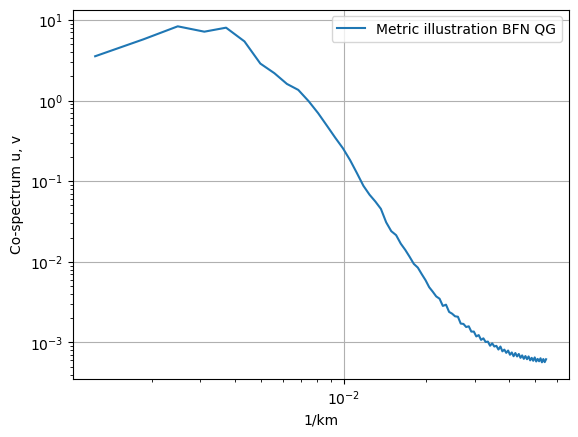
2. Plot spectrum#
[7]:
name_plot = 'Spectrum_metric_illustration_BFNQG.png'

from glob import glob
import os
list_spectrum_pickles = glob(os.path.join(outputdir,'spectrum_BFNQG1_region_metric_illustration_Agulhas_*.pyo'))


_ = spectrum.plot(list_spectrum_pickles,
                      outfile=outputdir+name_plot)
[ ]: