
Run Lagrangian CDm#

Velocity metrics package illustration: Run Lagrangian Cumulative Distance#
Agulhas, BFN-QG#
Authors: Datlas Copyright: 2023 Datlas License: MIT
Agulhas: BFNQG currents maps
Agulhas: BFNQG currents maps
The notebook aims to illustrate how to run the velocity metrics. Here, the example uses surface current maps produced by the BFN-QG in the Agulhas region.
The notebook aims to illustrate how to run the velocity metrics. Here, the example uses surface current maps produced by the BFN-QG in the Agulhas region.
[1]:
import velocity_metrics.lagrangian.drifters as drifters
import velocity_metrics.lagrangian.cumulative_distance as sde
import velocity_metrics.utils.constant as const
<Figure size 640x480 with 0 Axes>
<Figure size 640x480 with 0 Axes>
<Figure size 640x480 with 0 Axes>
[2]:
import os
import warnings
warnings.filterwarnings("ignore")
Parameters#
Input directories#
[3]:
input_dict = '../dc_data/DC_example_BFNQG_Agulhas/dictionnaries/'
input_drifter = '../dc_data/drifter/'
input_lagrangian_position = '../dc_data/lagrangian_position_pickle/'
Output directory#
[4]:
outputdir = '../results/metrics_illustration/'
Evaluated maps parameters#
[5]:
path_dict_product =  input_dict + 'data_type_metric_illustration_bfnqg.json'

# Index of the depth of your product (if only one depth and no index, just leave depth = 0)
depth = 0
Region parameters#
[6]:
path_dict_region = input_dict + 'region_metric_illustration_Agulhas.json'
Advection parameters#
[7]:
path_drifter_param = input_dict + 'drifters_parameters.ini'

## Using drifter position at 15m depth (also available at 00m depth)

#path_drifter_position = input_lagrangian_position + 'Fictive_pos_Drifters_AOML_region_T1_00m_20190101T000000Z_20200101T000000Z.json'
path_drifter_position = input_lagrangian_position + 'Fictive_pos_Drifters_AOML_region_T1_15m_20190101T000000Z_20200101T000000Z.json'

first_date = '20190101T000000Z'
last_date = '20190201T000000Z'

advection_days = 10
1. Advect drifters#
[8]:
%%time
_ = drifters.run_all_load_once(path_drifter_param, path_dict_product, path_drifter_position,
                 days_of_advection=advection_days, output_dir=outputdir, region=path_dict_region,
                 first_date=first_date, last_date=last_date, sdepth=depth)
Percent: [#############################-] 96.77%, ,
100%|████████████████████████████████████████████████████████████████████████████████████████████████████████████████████████████████████████████████████████████████████████████████████████████████████████████████████████████| 1811/1811 [00:19<00:00, 93.40it/s]
Saving pickle in ../results/metrics_illustration/data_type_metric_illustration_bfnqg_region_metric_illustration_Agulhas_dep0.pyo
CPU times: user 16.4 s, sys: 737 ms, total: 17.2 s
Wall time: 22 s
2. Compute SDE#
[9]:
## Using drifter position at 15m depth (also available at 00m depth)

# drifter_list = [input_drifter + 'Drifters_AOML_region_T1_00m_20190101T000000Z_20200101T000000Z.pyo.gz']
drifter_list = [input_drifter + 'Drifters_AOML_region_T1_15m_20190101T000000Z_20200101T000000Z.pyo.gz']

path_artificial_drifters = os.path.join(outputdir, 'data_type_metric_illustration_bfnqg_region_metric_illustration_Agulhas_dep0.pyo.gz')

outputfilename = 'SDE_region_T1_20190101-20190201'

_ = sde.run(path_artificial_drifters, drifter_list, output_dir=outputdir, output_filename=outputfilename)
100%|████████████████████████████████████████████████████████████████████████████████████████████████████████████████████████████████████████████████████████████████████████████████████████████████████████████████████████████████| 41/41 [00:07<00:00, 5.80it/s]
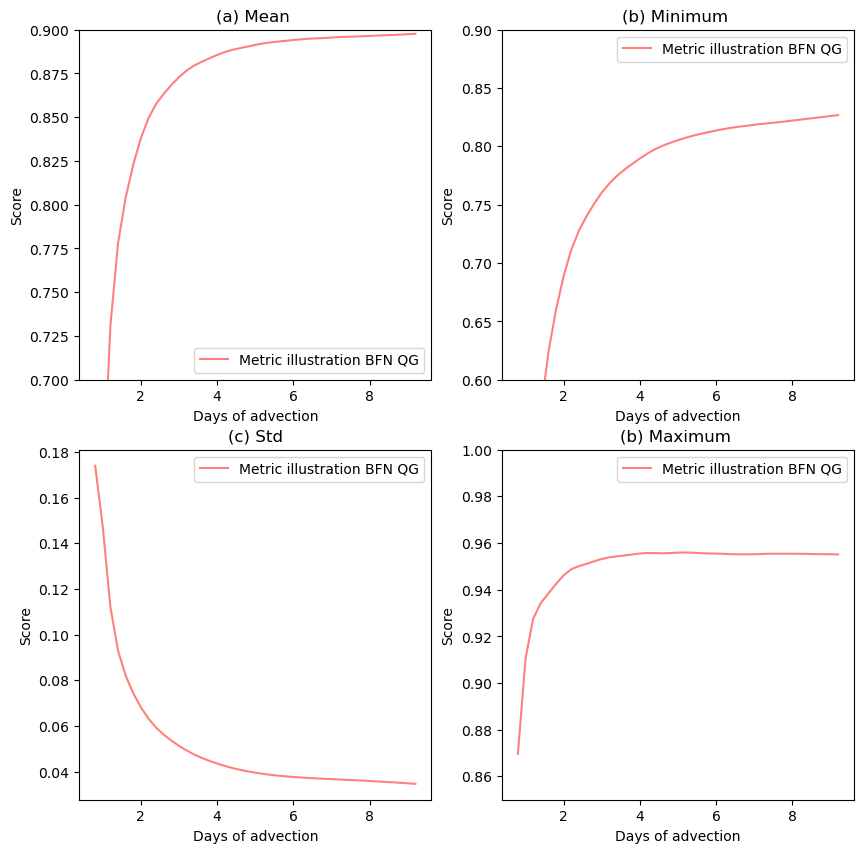
3. Plot SDE#
[10]:
list_sde = [outputdir+'SDE_region_T1_20190101-20190201_BFNQG1_15m.pyo.gz']

outputfilename = 'SDE_BFNQG_region_T1.png'

_ = sde.plot(list_sde, output_dir=outputdir,
             output_filename=outputfilename,
             list_color=['r'],
             plot_range={'mean': (0.70, 0.9), 'max': (0.85, 1), 'min': (0.6, 0.9)})
<Figure size 640x480 with 0 Axes>
[ ]: