
Run Front Diag#

Velocity metrics package illustration: Run front diagnostics#
Agulhas, BFN-QG#
Authors: Datlas Copyright: 2024 Datlas License: MIT
Agulhas: BFNQG currents maps
Agulhas: BFNQG currents maps
The notebook aims to illustrate how to run the velocity metrics. Here, the example uses surface current maps produced by the BFN-QG in the Agulhas region.
The notebook aims to illustrate how to run the velocity metrics. Here, the example uses surface current maps produced by the BFN-QG in the Agulhas region.
[1]:
import velocity_metrics.fronts.compare_fronts_vel as compare_fronts_vel
import velocity_metrics.fronts.box_metrics as box_metrics
import warnings
warnings.filterwarnings('ignore')
import sys
sys.path.append('../')
from src import utils
<Figure size 640x480 with 0 Axes>
<Figure size 640x480 with 0 Axes>
Parameters#
Input directories#
[2]:
input_dict = '../dc_data/DC_example_BFNQG_Agulhas/dictionnaries/'
input_fronts = '../dc_data/DC_example_BFNQG_Agulhas/fronts_Agulhas/'
## input_fronts = '../dc_data/fronts_seviri/' #for the full year
Output directory#
[3]:
outputdir = '../results/metrics_illustration/'
1. Compare fronts#
[4]:
data_type = input_dict + 'data_type_metric_illustration_bfnqg.json'
par_out = {"pattern": f'frontsvel_Agulhas_BFNQG_0m',
               "outdir": outputdir + 'fronts_outputs_bfnqg'}

front_pattern = 'seviri_sst_woc_t1'
gradient_threshold = 0.01
par_fronts = {"dir_front": input_fronts,
              "pattern": front_pattern,
              "gradient_threshold": gradient_threshold}

data_type = input_dict + 'data_type_metric_illustration_bfnqg.json'

region = input_dict + '/region_metric_illustration_Agulhas.json'

first_date = '20190101T000000Z'

last_date = '20190120T000000Z'


compare_fronts_vel.run(par_out, par_fronts, data_type,
                           region=region, depth=0,
                           first_date=first_date,
                           last_date=last_date,
                           syntool=False, ext='json')
Percent: [############################--] 95.00%, ,
100%|██████████████████████████████████████████████████████████████████████████████████████████████████████████████████████████████████████████████████████████████████████████████████████████████████████████████████████████████| 488/488 [00:30<00:00, 16.16it/s]
2. Run box metric#
[5]:
## In config_fronts.json, we use the bfnqg fronts just created (in ../results/metrics_illustration/fronts_outputs_bfnqg)
## and the duacs fronts distributed in the example (in ../dc_data/DC_example_BFNQG_Agulhas/fronts_outputs_duacs)

dic_list = box_metrics.run(input_dict+'config_fronts.json', 2,
                first_date='20190110T000000Z',
                last_date ='20190120T000000Z',
                output_dir=outputdir,
                plot=False)
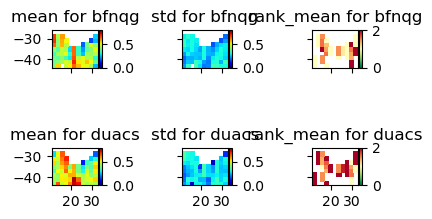
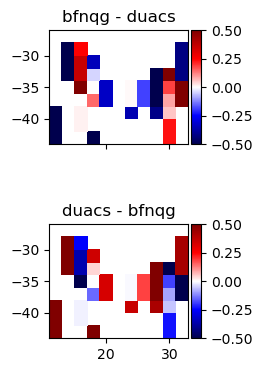
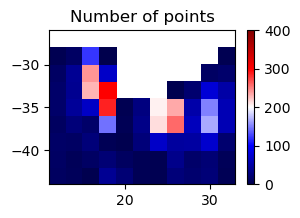
3. Plot front metrics#
[6]:
path = outputdir + 'bfnqg_duacs_2019-01-10T00:00:00.000000Z_2019-01-20T00:00:00.000000Z_mean.nc'

dic_list = box_metrics.run_plot(path,
                                input_dict+'config_fronts.json',
                                size=2,
                                dir_out=outputdir)
[ ]: